… or at least those individuals whose complete mitochondrial DNA sequence can be found in GenBank. MitoWheel was updated on March 8, 2008. New features:
- MitoWheel incorporates now data on fully sequenced human mitochondrial genomes that have been deposited in the GenBank nucleotide database by different research groups. This means at the moment 2982 complete human mitochondrial DNA sequences. You can type the GenBank accession number into the search field and you will get the list of mutations (positions that are different from the reference sequence). Of course, you can see multiple sequences at the same time (“AY665667, DQ862537”). In this case, the sequences will be distinguished by color. Well, you might ask, who will really search for DQ862537? Probably, you are right… But don’t stop reading!
- MitoWheel 1.2 is able to show a number of human mitochondrial sequences as a group. In the group view, mut
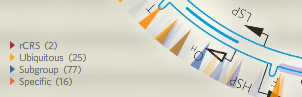 ations that occur in any of the sequences in the group are divided into four classes: (a) Mutations that are specific for the group, i. e. they cannot be found in any other known human mtDNA sequence, only in the analysed group. (b) Mutations that are present in all sequences belonging to the group (“ubiquitous“), but also occur outside of the group. (c) Mutations that are missing from some of the sequences, so they define a subgroup within the group. (d) At last, the status of certain sites is shown, although they are identical to the revised Cambridge reference sequence (rCRS). It is necessary, because the reference sequence itself carries some polymorphisms that actually represent a minority within the human population. At such nucleotide positions, where sometimes 98% of the human mtDNA sequences differ from the reference sequence, the lack of the “mutation” is more informative than its presence. For the same reason, rCRS polymorphisms are faded out if they fall into the “ubiquitous” group. Color intensity gives additional information about “specific” and “subgroup” mutations too: those that are carried by many individuals in the group are shown in bright color, while rare ones are faded out. You can also find exact numbers about these features in the info window: next to the name of the mutation, frequency data are shown. The first pair of numbers says how many sequences carry the mutation within the group, and the second pair of number describes how frequent the mutation is in the entire human population.
 - How to create groups of human sequences? By mutations! Select all sequences that carry a certain mutation, or select exactly those that lack it. You just simply have to type a “+” or a “-” in front
 of the name of the mutation. For example, “+4917G, +1888A, -12633A, -930A” means “include sequences that carry 4917G and 1888A, but lack both 12633A and 930A”. This will give a nice little group of 24 sequences with many characteristic mutations (“ubiquitous”), and a dark blue “subgroup” mutation, 11812G, that is missing only from one of the sequences (“23/24” in the info window). So why don’t you check out that subgroup by typing “+4917G, +1888A, -12633A, -930A, +11812G”? Are you aware that you are doing phylogenetics right now? You landed in a subgroup of the human T2 subclade in haplogroup T.
Tipp:
Navigation has been improved. When you are walking through multiple matches using the ENTER key or the red arrow in the search field, you can move to the opposite direction by holding down the SHIFT key. If you would like to move to a specific match, first spin the wheel somewhere close to the spot (using the white arrows or the arrow keys on your keyboard) and then use ENTER or SHIFT+ENTER (or the red arrow with or without SHIFT) to step to the exact position.
